Reports
The Reports feature of GearConnect is one of the most powerful tools in the application and can be found on the Report tab in the Main Nav Bar.
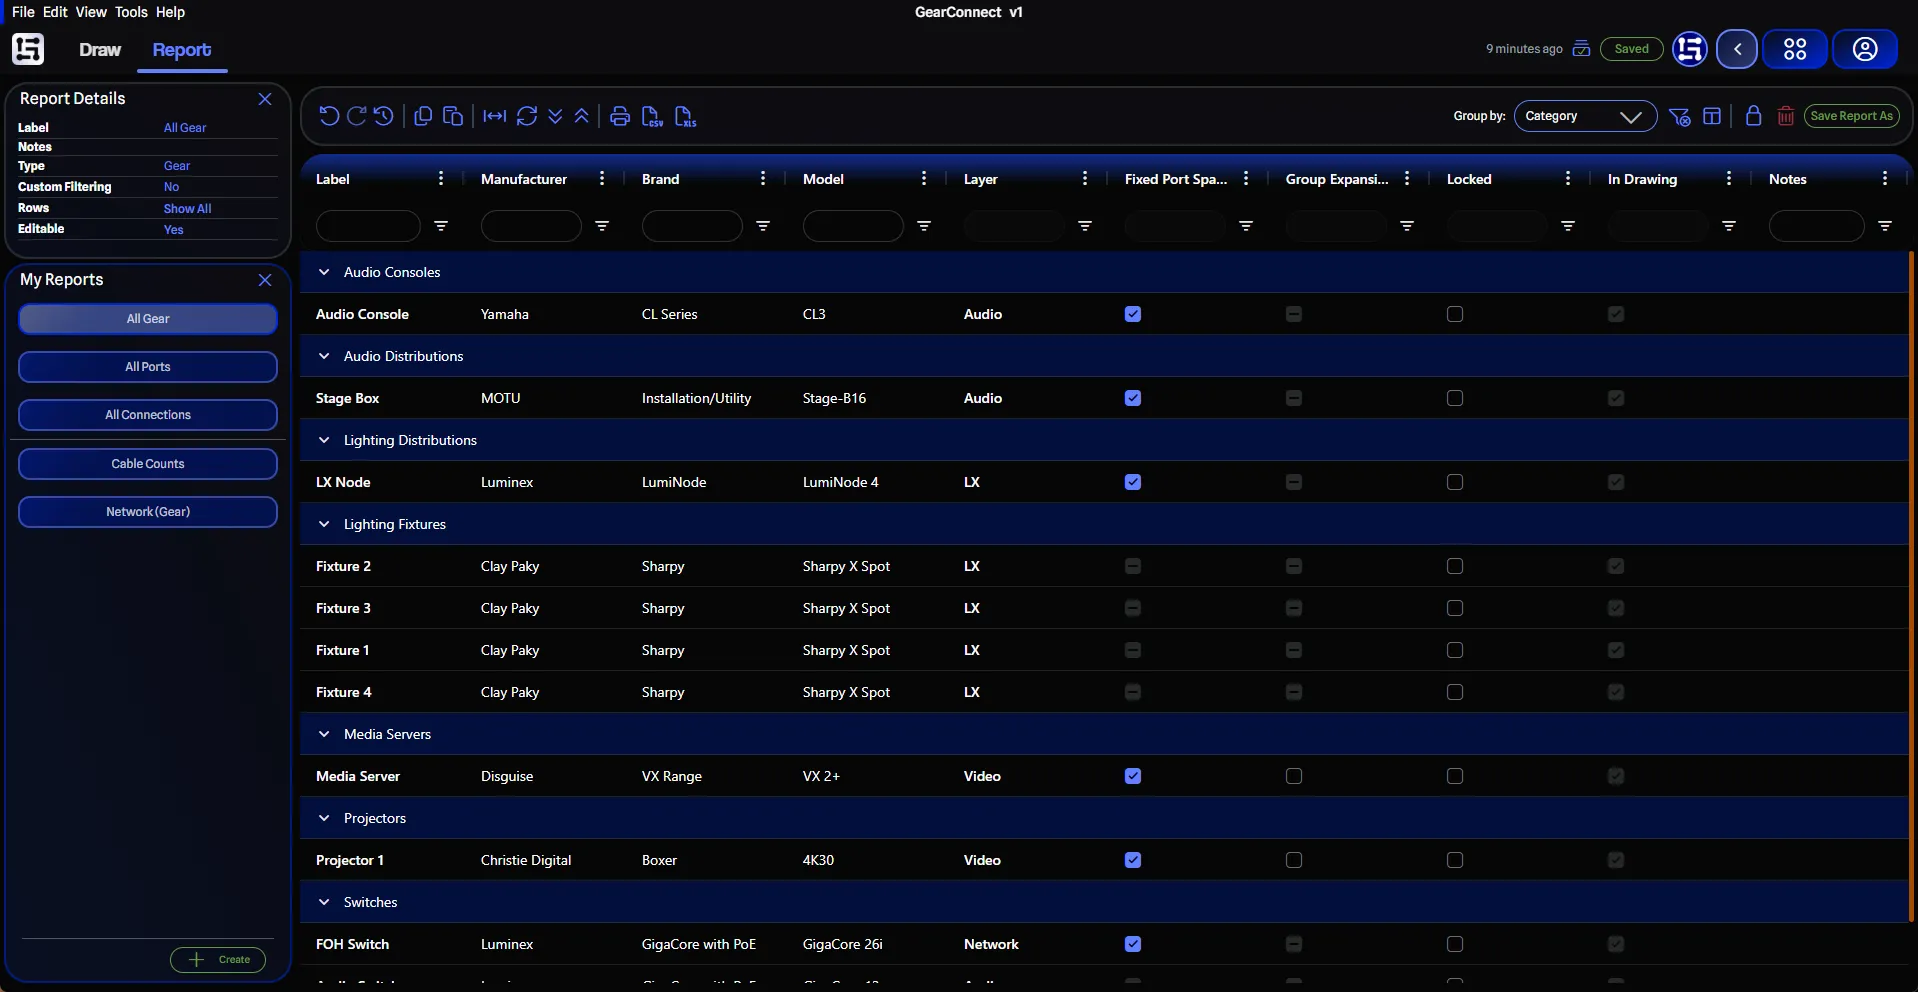
Reports should provide a familiar spreadsheet-like interface if you are used to Excel or Google Sheets.
It can be used to not only generate reports to export, but also a quick and easy way to view and edit your data.
Please refer to the layout sections for more information on the various parts of the page:
This page will focus on the features within the spreadsheet-like interface itself but other features of Reports are covered in the above pages.
Report Types
Section titled “Report Types”There are three types of reports in GearConnect:
- Gear: Displays information about the gear in your project, grouped by gear category.
- Ports: Displays information about the ports in your project, grouped by gear items.
- Connections: Displays information about the connections in your project, grouped by gear items.
Creating Custom Reports
Section titled “Creating Custom Reports”Create Report Dialog
In addition to using Save As on an existing report, new reports can also be created using the Create Report Dialog, which provides several templates to jump-start your report creation. These reports all act as starting templates for you to further customize as desired.
Please note that some templates have special filtering applied, preventing all project data from being displayed outside of their intended purpose. They will be indicated in the descriptions below.
Access this dialog by clicking the Create button in the My Reports pane or from File > New Report from the menu bar.
You may start from one of the following templates:
Generic Reports
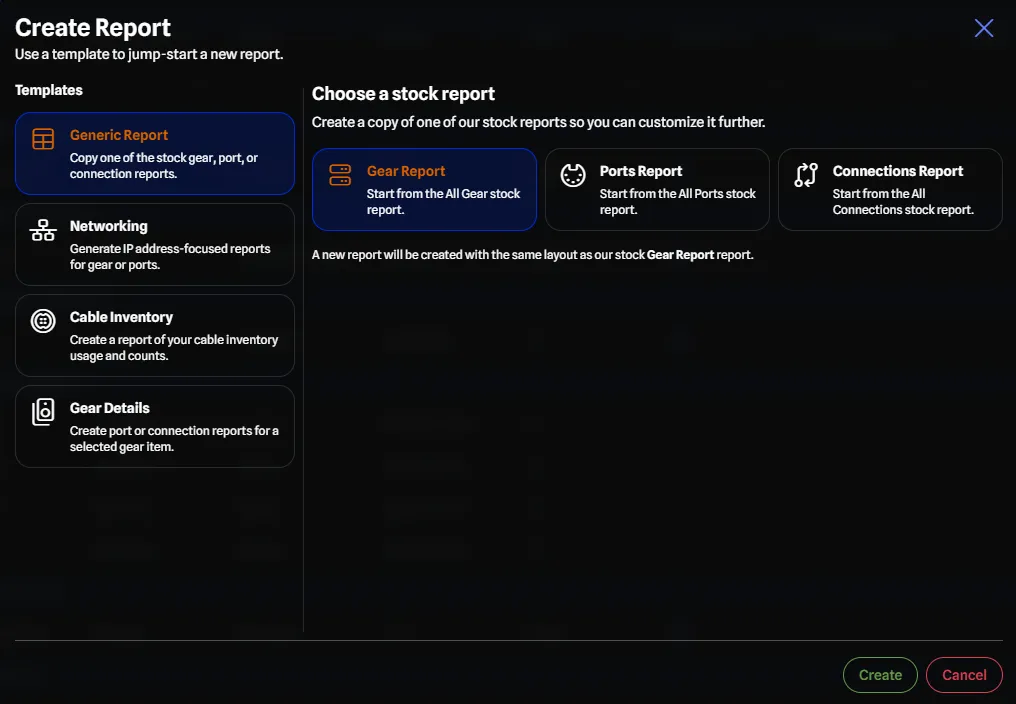
Copy one of the stock gear, port, or connection reports as a starting point for your custom report. These are based off our stock reports, and is a good starting point for most custom reports.
Available Options:
- All Gear: Start from the All Gear stock report.
- All Ports: Start from the All Ports stock report.
- All Connections: Start from the All Connections stock report.
Networking Reports
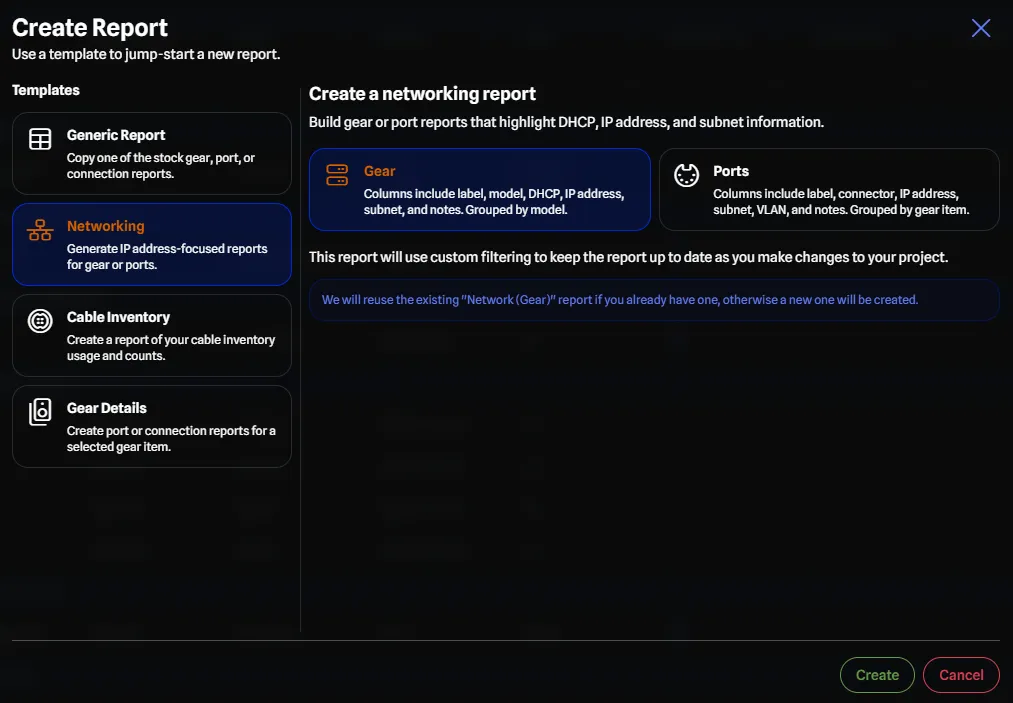
Generate IP address-focused reports for gear or ports with specialized networking columns. Not only does this help jump-start your network report creation, this template will dynamically stay up-to-date as you add or modify IP address information in your project.
These reports are great to quickly see all IP address information in your project at a glance.
Available Options:
- Network (Gear): Build gear reports that highlight networking information:
- Default columns: Label, Library Model, DHCP, IP Address, Subnet, Notes.
- Default grouping: Library Model.
- Default sorting: Label.
- Unique rows only: No.
- Network (Ports): Build port reports that highlight networking details:
- Default columns: Gear Parent, Sort Order, Label, Port Type, DHCP, IP Address, Subnet, VLAN, Notes.
- Default grouping: Gear Parent.
- Default sorting: Sort Order.
- Unique rows only: No.
Cable Inventory Reports
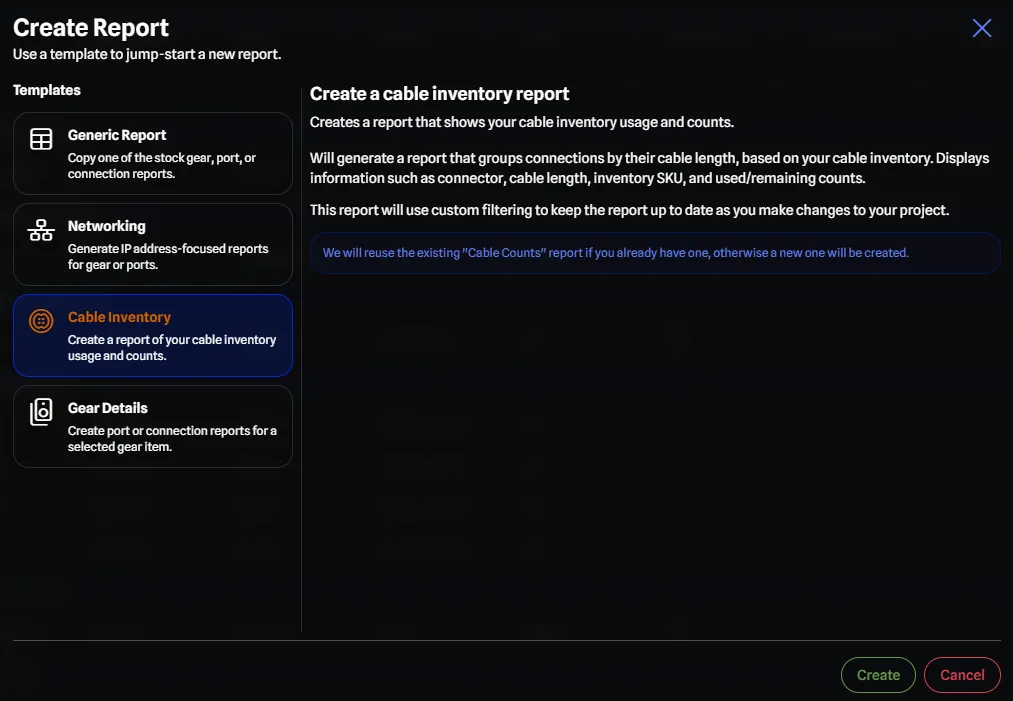
Create reports focused on cable usage and inventory management. This is useful for projects that utilize the Cable Inventory Manager to track cable stock and usage, so you can quickly see how many cables are used and how many remain in stock.
This template will dynamically stay up-to-date as you add or modify cable inventory information in your project.
You may also generate these reports by clicking on the Cable Count Report button in the Cable Inventory Manager.
Available Options:
- Cable Inventory: Generate reports showing cable inventory usage and counts:
- Default columns: Port Type, Cable Inventory Item, Cable Length, Cable Unit, Cable Inventory SKU, Cables Used, Cables Remaining.
- Default grouping: Cable Length.
- Default sorting: Cable Length.
- Unique rows only: Yes.
Gear Details Reports
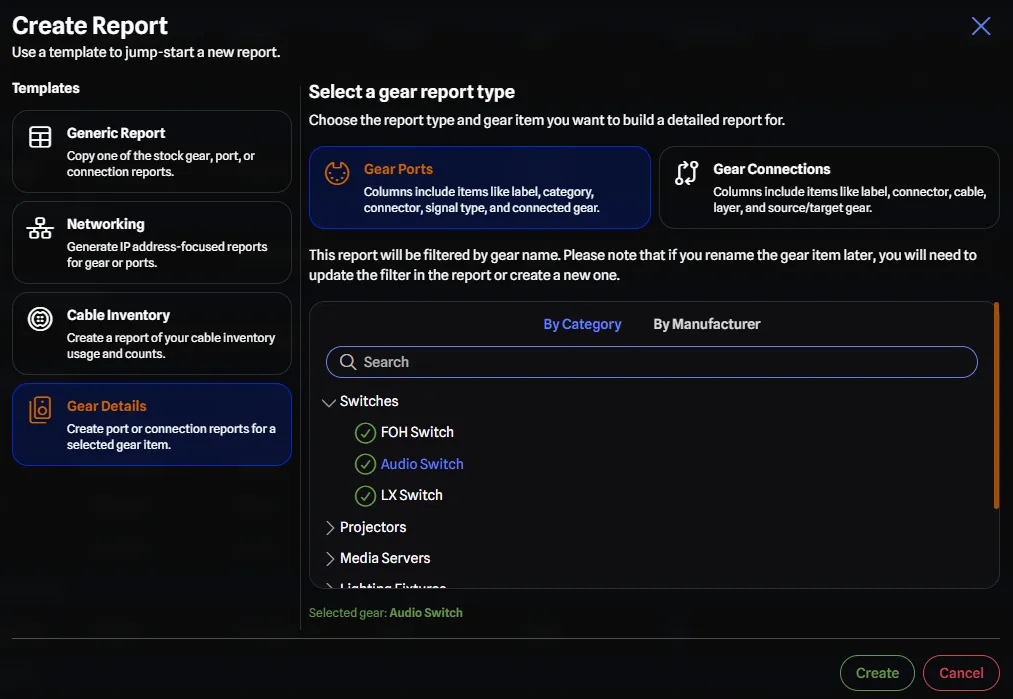
Create detailed reports for specific gear items in your project. These reports are filtered to only include ports or connections related to the selected gear item for the given report.
These reports are ideal for generating documentation for specific pieces of gear, or batch updating port or connection details for a specific piece of gear.
You must first select a gear item from the gear selector tree to create one of these reports. Please note that you can only generate these reports for gear currently used in the drawing.
You may also generate these reports by right clicking on a gear item in the drawing and selecting Port Report or Connection Report.
Available Options:
- Gear Details (Ports): Generate port reports for selected gear items:
- Default columns: Sort Order, Label, Expansion Card, Category, Port Type, Signal Type, Signal Flow, Connected Gear, Connected Port, Notes.
- Default grouping: Port Type.
- Default sorting: None.
- Unique rows only: No.
- Gear Details (Connections): Generate connection reports for selected gear items:
- Default columns: Label, Port Type, Cable Inventory Item, Use Port Colour, Use Layer Colour, Layer, Source Connected Gear, Source Connected Port, Target Connected Gear, Target Connected Port.
- Default grouping: Port Type.
- Default sorting: None.
- Unique rows only: No.
Keyboard Controls
Section titled “Keyboard Controls”You can use the following keyboard shortcuts in the Reports feature:
- Arrow Keys: Move around the report.
- Enter: Edit a cell.
- Space: Toggle a checkbox cell.
- Tab: Move to the next cell.
- Shift + Tab: Move to the previous cell.
- Ctrl + C: Copy the selected data.
- Ctrl + V: Paste the copied data.
- Ctrl + Z: Undo the last change (requires Local Mode).
- Ctrl + Y: Redo the last change (requires Local Mode).
- Ctrl + Arrow Keys: Move to the edge of the data.
- Shift + Arrow Keys: Select multiple cells.
- Ctrl + Shift + Arrow Keys: Select multiple cells in a row or column.
Columns
Section titled “Columns”Column Data
Section titled “Column Data”Depending on the report you are viewing (Gear, Ports, or Connections), the columns will change to reflect the data you are viewing.
Gear Columns
Section titled “Gear Columns”Below are all the columns available in the Gear report:
| Column | Default Visibility | Is Data Editable |
|---|---|---|
| Gear Type | Hidden | No |
| Code | Hidden | No |
| Label | Visible | Yes |
| Version | Hidden | No |
| Manufacturer | Visible | No |
| Brand | Visible | No |
| Model | Visible | No |
| Layer | Visible | Yes |
| DHCP | Hidden | Yes1 |
| IP Address | Hidden | Yes1 |
| Subnet | Hidden | Yes1 |
| Detail Mode | Hidden | No |
| Fixed Port Spacing | Visible | Yes |
| Group Expansion Ports | Visible | Yes |
| Locked | Visible | Yes |
| In Drawing | Visible | No |
| Notes | Visible | Yes |
1 Applicable to IP address eligible gear listed here.
Port Columns
Section titled “Port Columns”Below are all the columns available in the Ports report:
| Column | Default Visibility | Is Data Editable |
|---|---|---|
| Gear Item | Hidden | No |
| Code | Hidden | No |
| Number | Visible | Yes |
| Label | Visible | Yes |
| Version | Hidden | No |
| Expansion Card Manufacturer | Hidden | No |
| Expansion Card Brand | Hidden | No |
| Expansion Card | Visible | No |
| Expansion Card Slot Size | Hidden | No |
| Expansion Card Group | Hidden | No |
| Visible | Visible | Yes |
| Category | Hidden | Yes1 |
| Block | Hidden | Yes |
| Connector | Visible | Yes1 |
| Direction | Visible | Yes1 |
| Signal Type | Visible | Yes1 |
| Signal Flow | Visible | Yes1 |
| Speed | Hidden | Yes1 |
| Group Order | Hidden | Yes2 |
| Side | Hidden | Yes2 |
| DHCP | Hidden | Yes3 |
| IP Address | Hidden | Yes3 |
| Subnet | Hidden | Yes3 |
| VLAN | Hidden | Yes4 |
| Connected Gear | Visible | No |
| Connected Port | Visible | No |
| Connection Label | Hidden | No |
| Notes | Visible | Yes |
1 These columns are editable when in Full Edit Mode or when the port supports Multi-Mode.
2 Group Order and Side are group-level properties - editing them on one port applies the change to the entire port group. Side options depend on gear type (Detail Mode: Auto/Split/Left/Right; Standard Mode: Auto/Split/Top/Bottom). Requires Local Mode. See Port Sorting & Reordering for more details.
Connection Columns
Section titled “Connection Columns”Below are all the columns available in the Connections report:
| Column | Default Visibility | Is Data Editable |
|---|---|---|
| Code | Hidden | No |
| Label | Visible | Yes |
| Version | Hidden | No |
| Bidirectional | Hidden | No |
| Needs Adapter | Hidden | No |
| Signal Warning | Hidden | No |
| Connector | Visible | No |
| Cable | Visible | Yes |
| Cable Length | Hidden | No |
| Cable Unit | Hidden | No |
| Cable Inventory SKU | Hidden | No |
| Cables Used | Hidden | No |
| Cable Remaining | Hidden | No |
| Use Port Colour | Visible | Yes |
| Use Layer Colour | Visible | Yes |
| Primary Colour | Hidden | Yes |
| Secondary Colour | Hidden | Yes |
| Layer | Visible | Yes |
| Source Connected Gear | Hidden | No |
| Source Connected Port | Hidden | No |
| Target Connected Gear | Visible | No |
| Target Connected Port | Hidden | No |
| Source VLAN | Hidden | No |
| Target VLAN | Hidden | No |
| Total (Connectors) | Hidden | No |
| Notes | Visible | Yes |
Column Selection
Section titled “Column Selection”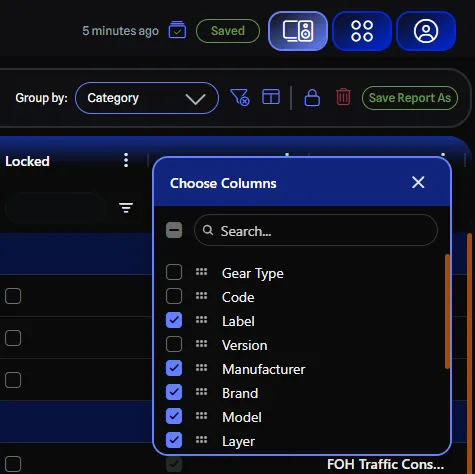
Column visibility and order can be customized through a dedicated column selection dialog. This dialog provides full control over which data fields are displayed in your report and allows you to arrange them in your preferred order.
To access the column selection dialog, click the Choose Columns button in the toolbar. Within the dialog, you can:
- Show or hide columns - Toggle the visibility of individual data fields by checking or unchecking them.
- Reorder columns - Drag and drop columns to arrange them in your preferred sequence.
- Search for columns - Use the search bar to quickly find specific data fields by name.
Changes made in the column selection dialog are applied immediately to your report view and become available to be saved (Pro feature). This allows you to customize and build custom reports tailored to your specific project needs, focusing on the data that matters most to you.
Auto Adjust Column Width
Section titled “Auto Adjust Column Width”From the same hamburger menu, you can also auto adjust column width by clicking on the second tab in the menu. This will give you three options:
- Autosize This Column: This will adjust the width of the column to fit the widest cell in the column.
- Autosize All Columns: This will adjust the width of all columns to fit the widest cell in each column.
- Reset Column Widths: This will reset all column widths to the default width.
Moving and Resizing Columns
Section titled “Moving and Resizing Columns”You can move columns by clicking and dragging the column header to the desired location. You can also resize them by clicking and dragging the column header to the desired width as well.
Rows and Data
Section titled “Rows and Data”Each row in the report is grouped under a parent row. The parent row doesn’t contain any data but is used to group the child rows under it. You can expand or collapse the parent row by clicking on the arrow next to the row label.
Groups are based on a column in the report, and you can change the grouping by clicking on the Group By button in the toolbar.
See Report Grouping for more information on the available grouping options.
Row Data
Section titled “Row Data”Several cells in the report are editable (indicated by bold text). To edit a cell, simply double click on the cell or press Enter. You can then type in the new data and press Enter again to save the data.
Some cells have dropdowns to select from. You can click on the dropdown arrow to bring up the options. When you click one of the options, the cell will be updated with the new data.
Some cells are checkboxes, and while you can still double click or press Enter to edit them, you can also click on the checkbox to toggle it on or off, or press Space to toggle it.
Filtering Data
Section titled “Filtering Data”You can filter data in the report by clicking on the filter bar above each column and typing in the filter you want.
Advanced Filtering
Section titled “Advanced Filtering”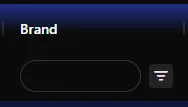
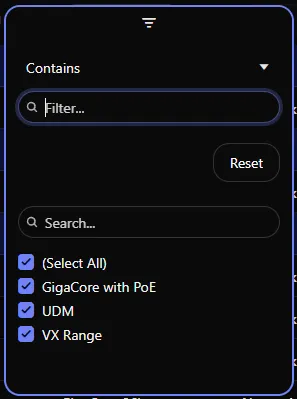
By clicking on the filter button which is next to the filter bar, you can bring up the advanced filtering options.
Search Operators
Section titled “Search Operators”Different columns have slightly different filtering options depending on the field type. Most columns (text fields) support the standard text operators, while number fields have additional numeric comparison options.
Text Fields
Section titled “Text Fields”Most columns support the following text-based operators:
- Contains
- Does not contain
- Equals
- Does not equal
- Begins with
- Ends with
- Blank
- Not blank
Number Fields
Section titled “Number Fields”Number fields support the following numeric operators:
- Equals
- Does not equal
- Greater than
- Greater than or equal to
- Less than
- Less than or equal to
- Between
- Blank
- Not blank
You can clear the filter by clicking on the Reset button.
Filter by Value
Section titled “Filter by Value”You can also filter by value by selecting or deselecting the checkboxes next to the values you want to filter by. You can search for a value by typing in the search bar.
Copying and Pasting Data
Section titled “Copying and Pasting Data”You can copy and paste data in the report by selecting the data you want to copy, pressing Ctrl+C (or Cmd+C on Mac),
moving to the cell you want to paste the data into, and pressing Ctrl+V (or Cmd+V on Mac). Only valid data can be
pasted into a cell, meaning you cannot paste any data into a layer column that doesn’t exist in the layer dropdown.